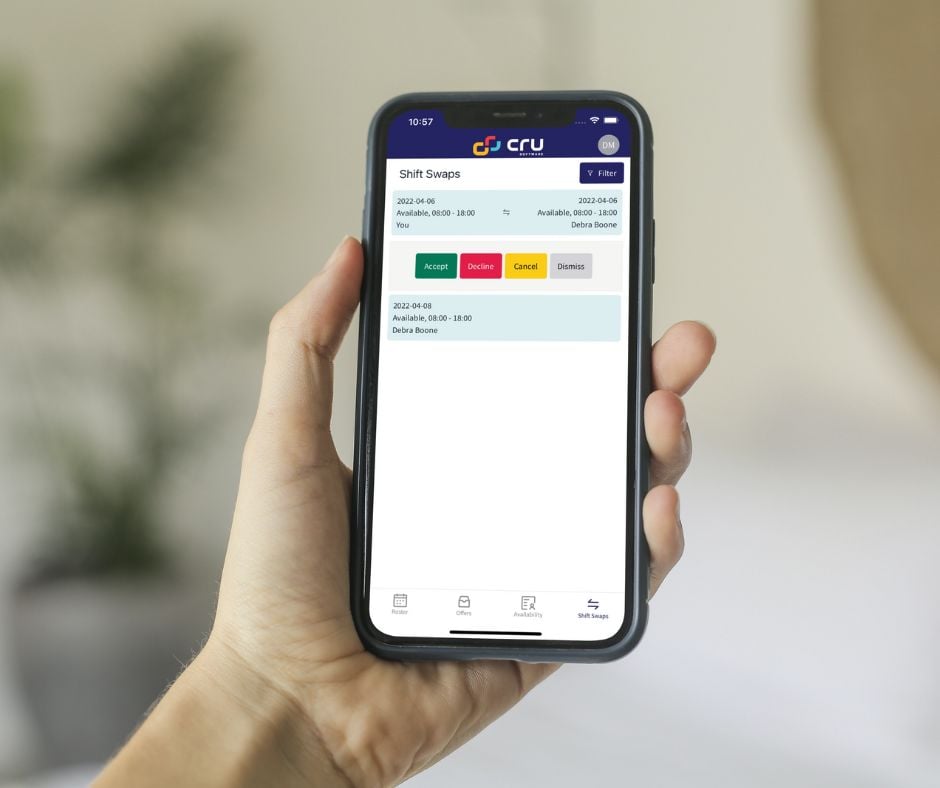
Proof of Value demonstration
A demo tailored to your business
If you’re planning a company-wide digital transformation, it can be tricky to visualise how a software solution would work with your business.
Investing in an enterprise solution is a big decision. You might be wondering:
- How can I see our data in the tool to ensure it works?
- Is it any better than our current process?
- It is worth the investment?
That’s why we offer a demonstration of Cru Software tailored and configured specifically to your organisation and its data. We don’t just demonstrate how our software works; we demonstrate how it will work for you.
What's involved?
When you undertake a Proof of Value process with us, we begin by focusing on one of your business issues or ‘pain points’ and show you how our software can solve it.
How Long?
- 4 - 8 weeks, with a one full-day workshop
What's included?
- Tailored configuration in Sandbox environment
- Additional data validation
How will we be supported?
- Training
- Weekly check-ins
- Dedicated Account Manager
What will we get at the end?
- Post-implementation debrief
- Detailed analysis report
- Comprehensive business case support documentation
- Project outcomes presentation
What are the benefits?
A Proof of Value process is designed to show you, in a practical way, how our software could transform your business. It’s a low-cost, collaborative way for you to evaluate how the solution will work for you – before you invest in it.
Proof of Value can increase stakeholder buy-in and sets the wheels in motion for approval of the full implementation.
If you go ahead and invest in Cru Software after the demo process, you’ll benefit from:
- no upfront software cost
- minimal time to get started
- insights into key metrics, such as activity alignment, locations, workers and more
- a starting platform that’s already set up and ready to be fully implemented.
The Results
We worked with Cru to understand what was really happening within our business. The POV project focused on how we were distributing work packages to our suppliers, and where we could obtain improvements. During the investigation phase, an estimated 12% of activities were found to be misaligned. After running the schedule optimisation we achieved a reduction of visits by 9%, with some larger sites achieving a 23% improvement to the alignment of activities.
Manager Infrastructure - Operations & Service Delivery
QLD based Water Utility
Misaligned Activity
POC found an estimated 12% of activities were misaligned.
Reduction of Visits
Schedule optimisation engine reduced number of visits by 9%
Improved Alignment
Larger sites achieved up to 23% improvement to the alignment of activities.
This approach often leads to greater stakeholder buy-in and sets the wheels in motion for approval of the full implementation.
Our customers










.png?width=200&height=100&name=EM1%20-%20Workforce%20Fatigue%20Management%20Resize%20(2).png)
.png?width=200&height=100&name=EM1%20-%20Workforce%20Fatigue%20Management%20Resize%20(3).png)
.png?width=200&height=100&name=EM1%20-%20Workforce%20Fatigue%20Management%20Resize%20(1).png)

.png?width=200&height=100&name=EM1%20-%20Workforce%20Fatigue%20Management%20Resize%20(4).png)
Find out more
%20(400%20%C3%97%20296%20px)%20(1).png?width=400&height=296&name=EM1%20-%20Workforce%20Fatigue%20Management%20Resize%20(160%20%C3%97%20200%20px)%20(400%20%C3%97%20296%20px)%20(1).png)
Automated Roster Management
Benefits of automating rostering over Excel
%20(400%20%C3%97%20296%20px)%20(2).png?width=400&height=296&name=EM1%20-%20Workforce%20Fatigue%20Management%20Resize%20(160%20%C3%97%20200%20px)%20(400%20%C3%97%20296%20px)%20(2).png)
Smarter Scheduling for operations & maintenance
Learn from our customer case study - Origin Energy
.png?width=400&height=296&name=Cru%20Rostering%20Desktop%20Proof%20of%20Value%20(1).png)
The high price of digital disconnection
Spreadsheets are great - until they are not
